Understanding the plotter’s geometry#
It’s not at all easy to understand intuitively how different arm lengths and servo sweep angles will affect the drawable area, and discovering this through trial and error while building a plotter is a painful process.
The turtle_plotter.py module uses Python’s built-in turtle graphics module to provide a handy
way to visualise the drawing area, and helps reveal some useful information about the way the plotter’s geometry makes
a difference to what it can draw.
Visualising a BrachioGraphTurtle instance#
In these examples, we will use and modify the provided BrachioGraphTurtle instance in bgt.py.
To use it with some default values, run:
python bgt.py
The grid#
If commanded with the draw_grid() method, the turtle graphics module will draw a grid. The origin of the grid -
position (0, 0) - is the axis of the shoulder servo.
The grid is always a little larger than the maximum reach of the arms in all directions, as defined when the
BrachioGraphTurtle class is first instantiated. If you change the inner_arm or inner_arm values while using
the same grid, the new plotted results may not actually fit.
The arms#
If commanded with the draw_arms() method, a representation of the arms (the inner arm is blue, the outer arm is
red) at various positions will be drawn.
The arcs#
If commanded with the draw_arcs() method, lines will be drawn to represent what would be drawn if the outer arm
were swept through its range of motion, for a range of steps through the motion of the inner arm.
The outline#
The outline is composed of four distinct arcs. The different coloured arcs shown in the example above represent different extremes of the servos’ ranges.
blue: the arc that can be drawn the furthest away from the origin (elbow is at maximum left)
purple: the arc that can be drawn the closest to the origin (elbow is at maximum right)
red: the most anti-clockwise possible arc (shoulder is at maximum left)
orange: the most clockwise possible arc (shoulder is at maximum right)
The title#
The title displays the length, centre angle and sweep angle of the inner and outer arms when the BrachioGraphTurtle was instantiated. (If any of these are changed while making multiple plots, you can use title() so that
it displays a descriptive title instead.)
Theoretical and practical drawing areas#
Consider a BrachioGraph with the following geometry:
inner_arm = 8                 # the length of the inner arm (blue)
shoulder_centre_angle = -90   # the centre of the outer arm, relative to the y-axis
shoulder_sweep = 180          # the arc covered by the shoulder motor

outer_arm = 8                 # the length of the outer arm (red)
elbow_centre_angle = 90       # the centre of the outer arm relative to the inner arm
elbow_sweep = 180             # the arc covered by the elbow motor
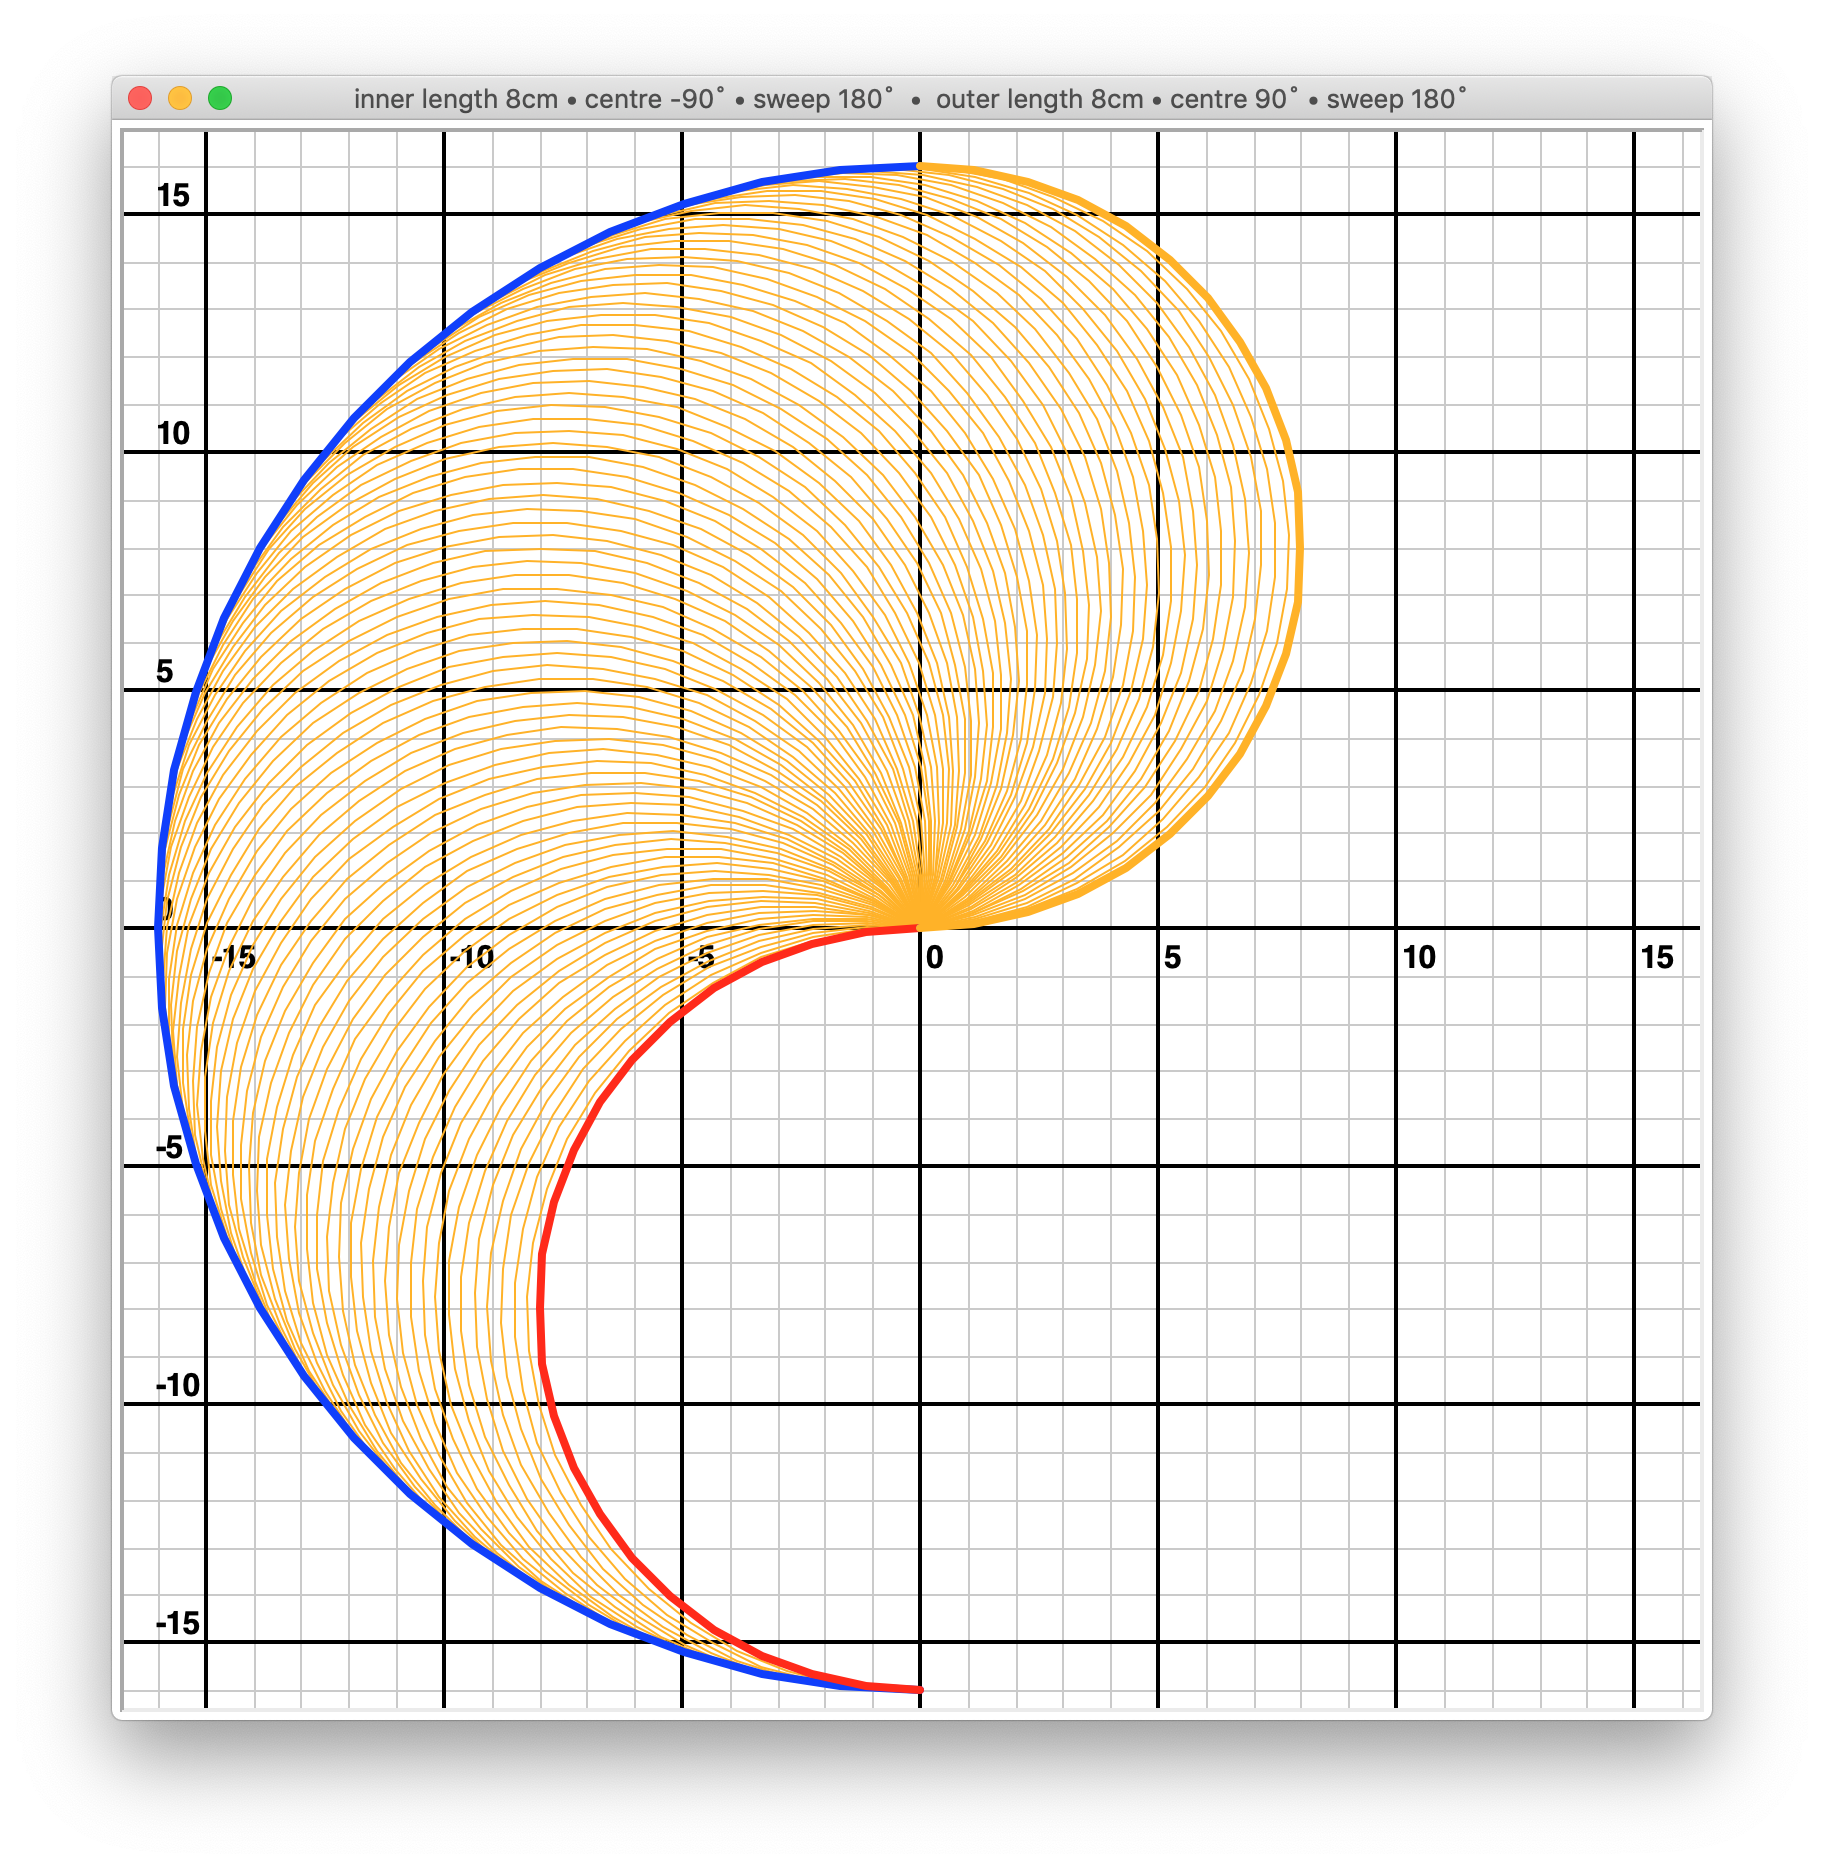
This is a mathematically theoretical drawing area. In practice, unless you have some very unusual paper to draw on, what’s actually useful to us is a drawing rectangle.
Avoiding the origin#
The area around the servo at the origin can’t be drawn on (because the pen or the servos would obstruct each other). This will vary depending on the size of the servos and the way you have mounted the arms, but a minimum distance of 4cm is reasonable as a starting point. It gives us some options that look like this:
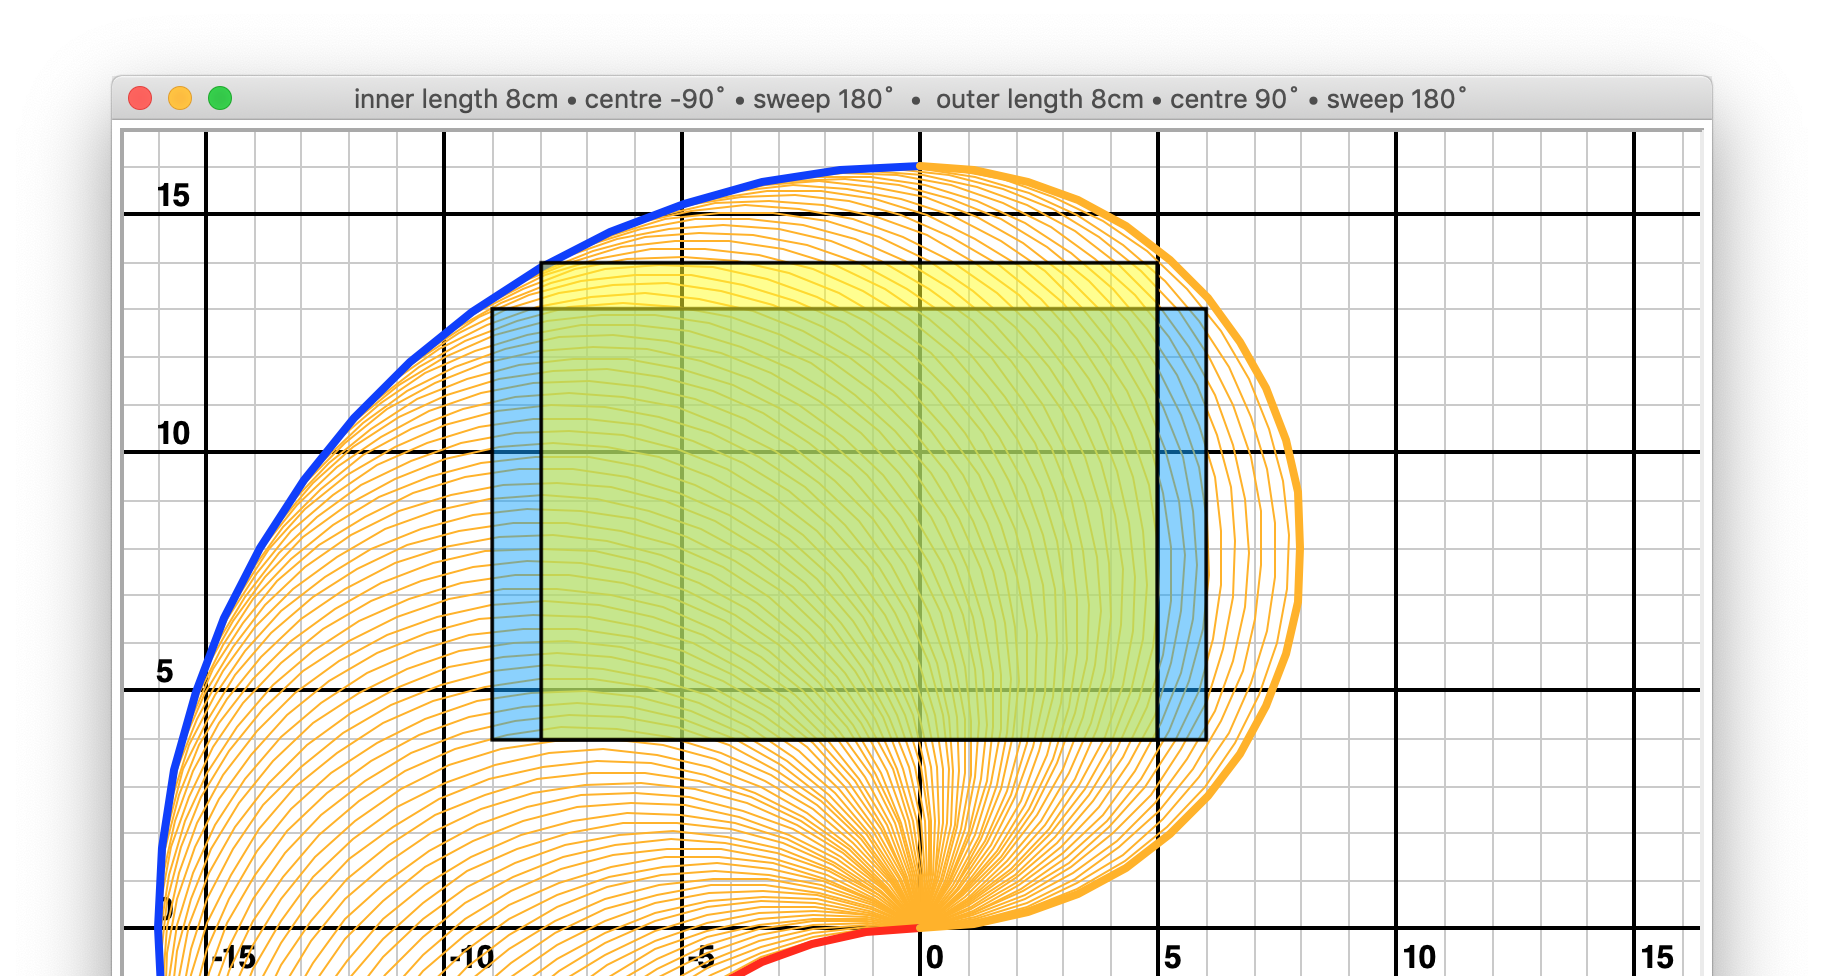
shoulder_centre_angle: -90
elbow_centre_angle:     90
shoulder_sweep:         180
elbow_sweep:            180

rectangles: 15 x  9 = 135
            13 x 10 = 130
(Note that these and all subsequent examples are approximations to the nearest centimetre.)
Servo limits#
Another constraint is the rotational behaviour of the servos. Physically, most servos will rotate up to 90˚ in each direction, but most are not actually designed to be used that way. Some servos rotate up to 180˚ quite well, even though it’s outside their specification (for example the Tower Pro SG90s. However it’s not a good thing to rely on, and it’s definitely not a good assumption to make of all servos. This is because:
although many servos respond to pulse-widths from 500 to 2500 µs, most are specified for 1000-2000 µs (corresponding to 120˚) and can be damaged by inputs outside this range
beyond 120˚, some motors become unusably twitchy and inaccurate
for most servos, even the SG90s that seem to cope with 180˚ of rotation, the actual specification is for 120˚ so it’s likely that better results can be found within this range.
Set the shoulder_sweep and elbow_sweep values both to 120:
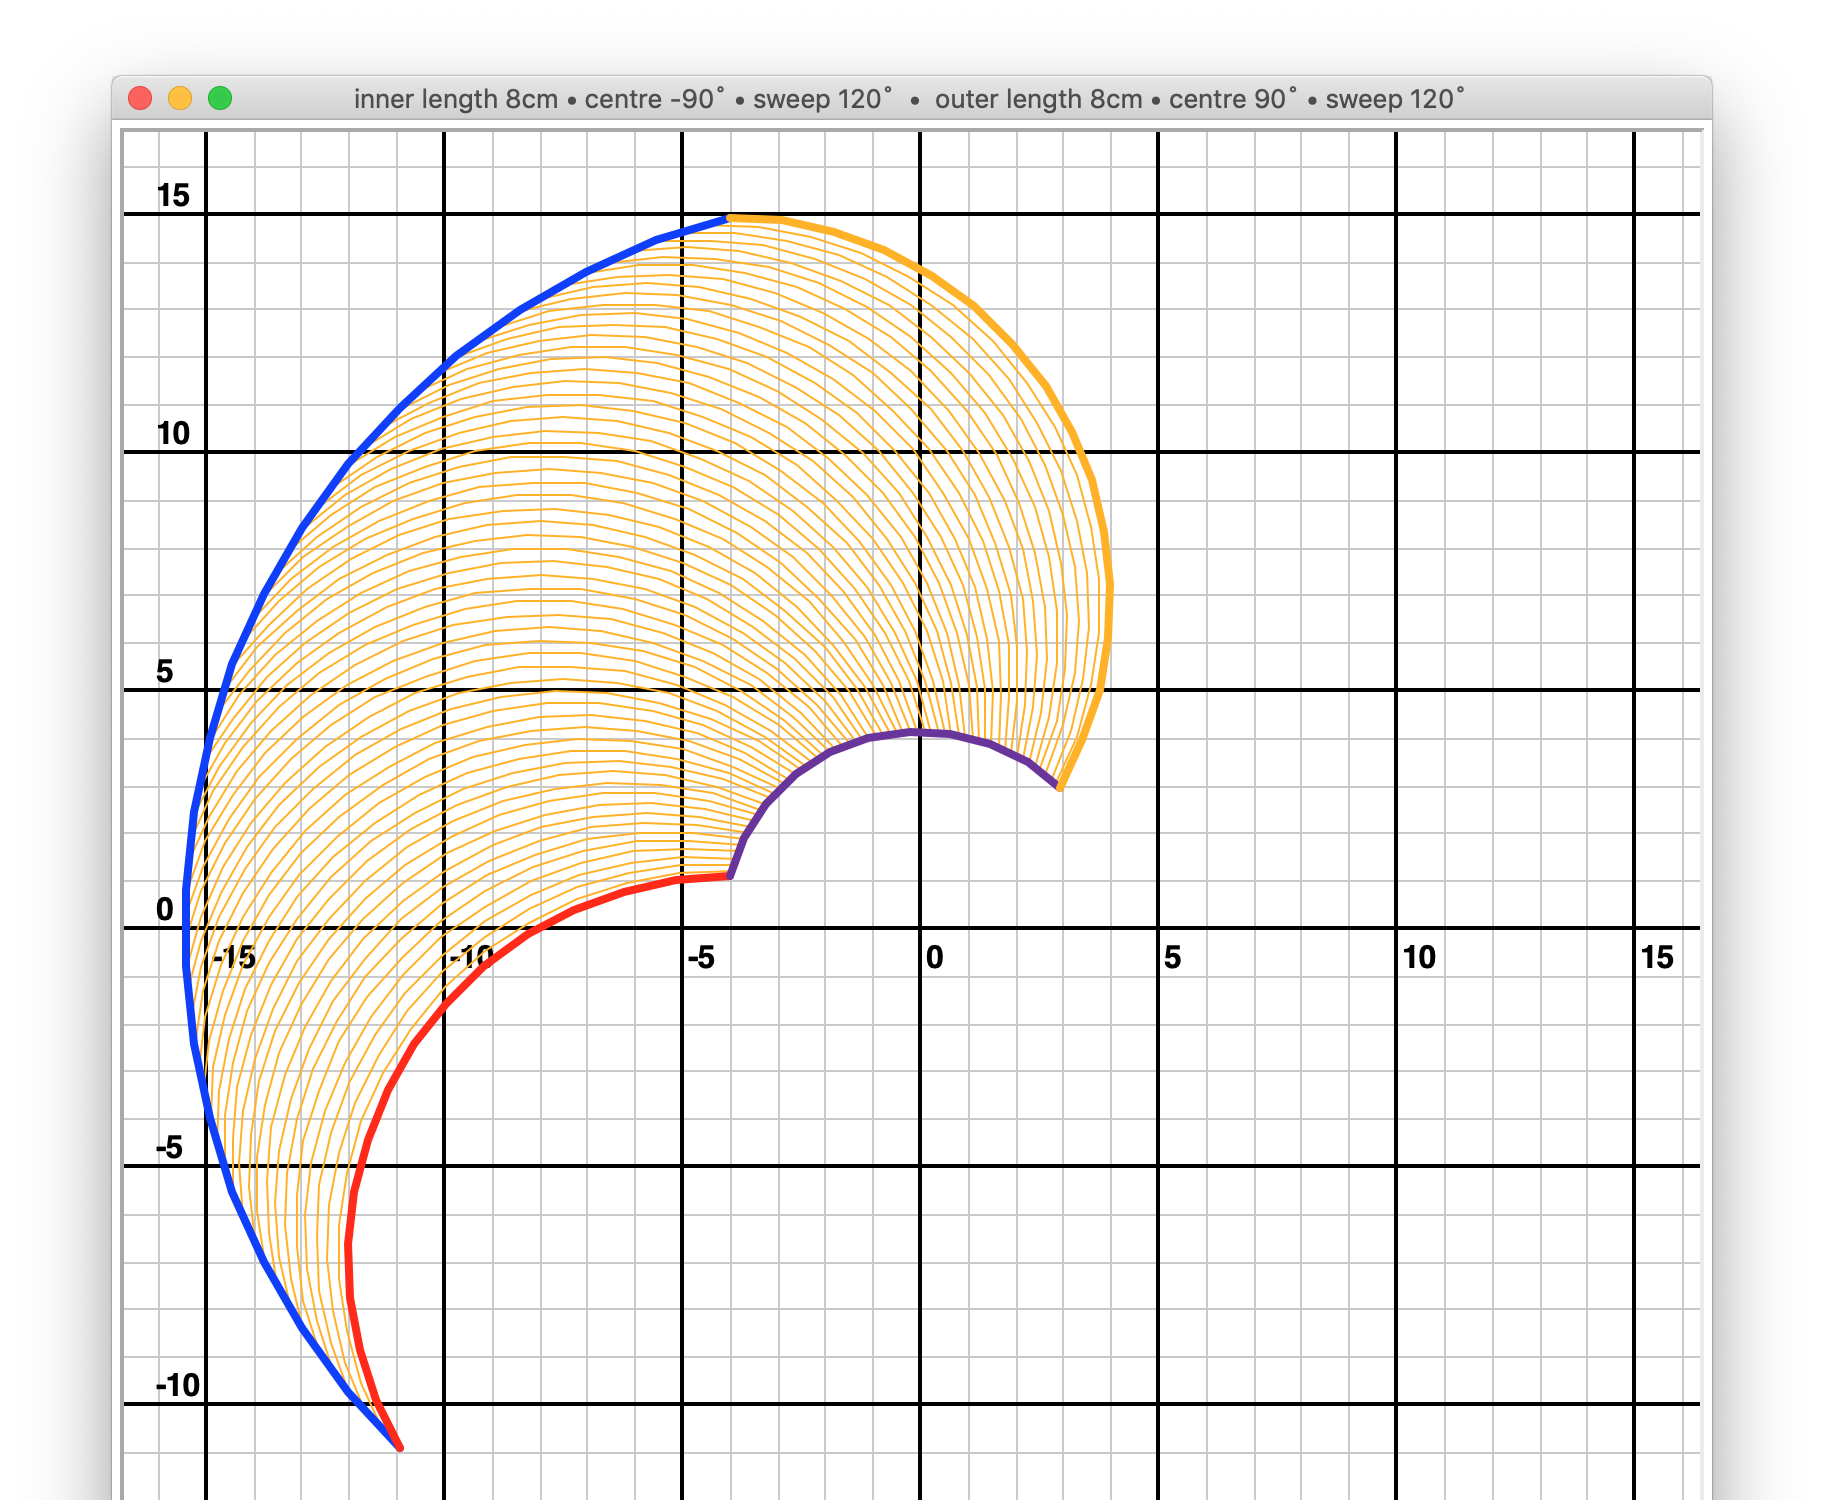
As you can see, we have lost quite a lot of the plotting area as a result.
Rotating the drawing area#
You will often need to rotate the drawing area to position it usefully and maximise its size.
In the example above, we are not making good use of the available plotting area. If the paper is rotated
relative to the plotter arms, we can make more use of it. Try rotating the plot to the right, by setting
shoulder_centre_angle to -59˚ instead of 90˚ (this is a value arrived at by trial and error).
The shoulder_centre_angle is the angle of the middle of the shoulder motor’s sweep, relative to 0˚.
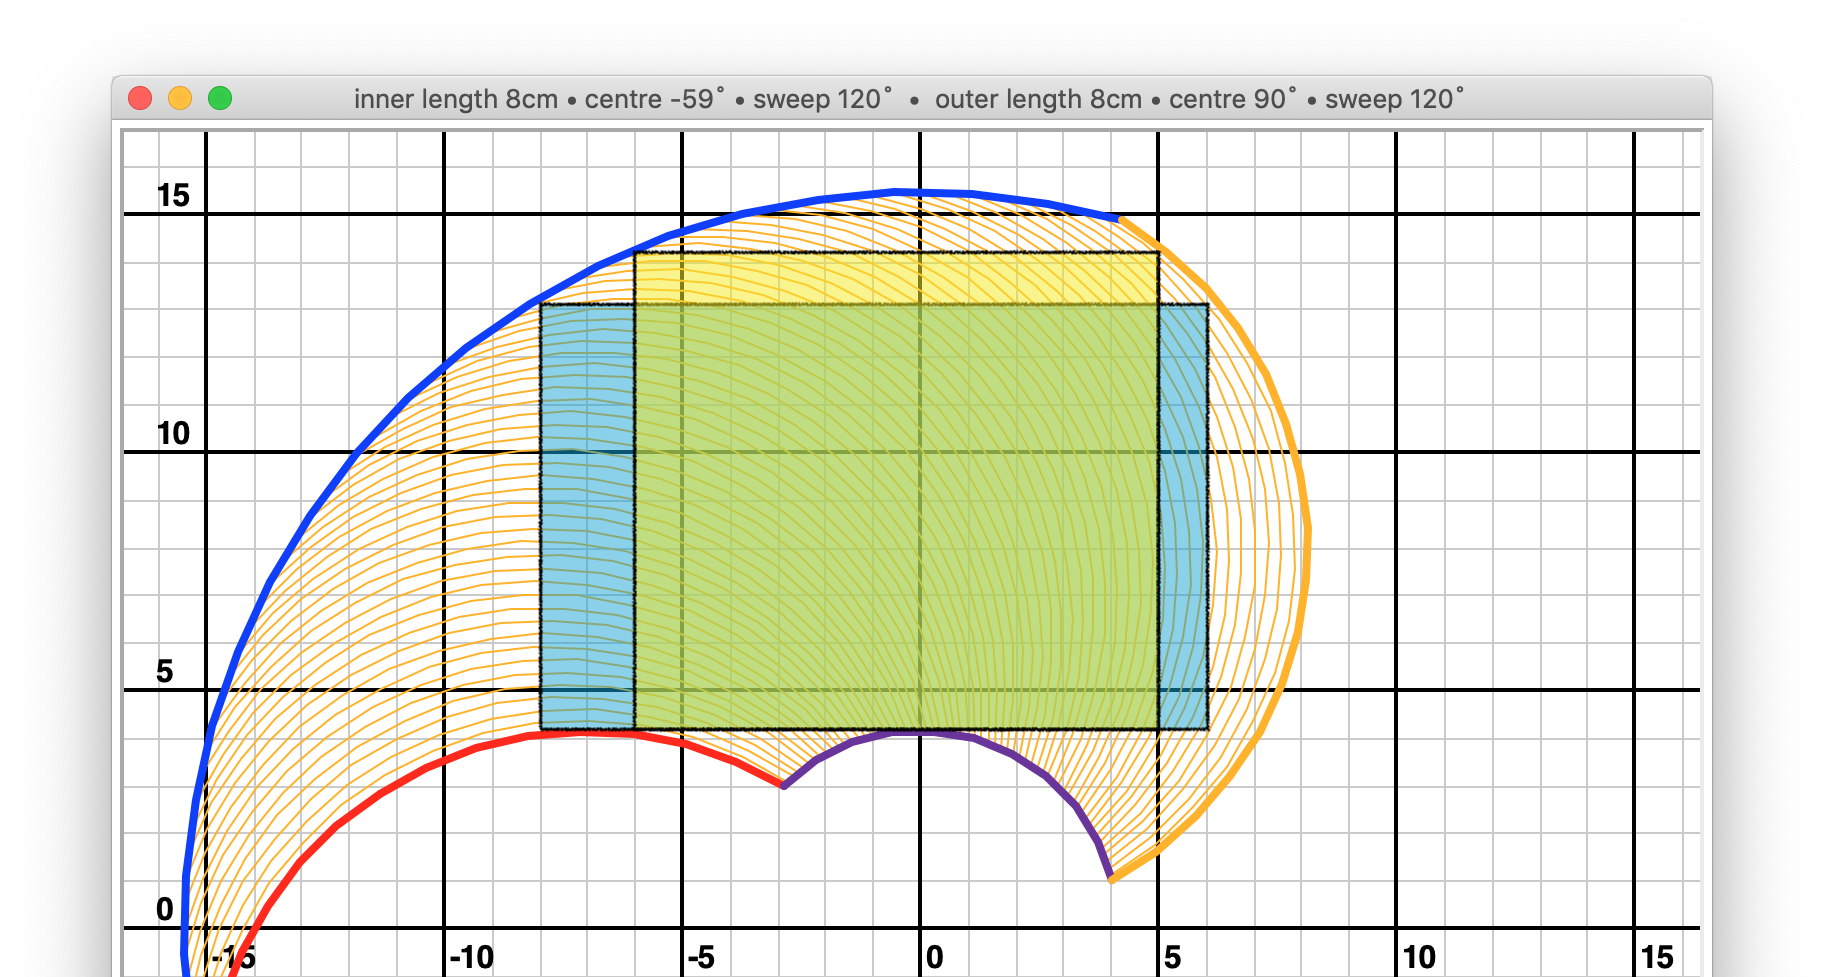
shoulder_centre_angle: -59
elbow_centre_angle:     90
shoulder_sweep:         120
elbow_sweep:            120

rectangles: 14 x  9 = 126
            11 x 10 = 110
Adjusting shoulder_centre_angle and elbow_centre_angle#
Experiment with different values of shoulder_centre_angle and the elbow_centre_angle.
allowing the elbow to reach angles less than 0˚ or more than 180˚ is worse than useless (so the
elbow_centre_angleplus and minus half of theelbow_sweepshould be between 0 and 180)
Other things being equal:
rotating the
elbow_centre_angleanti-clockwise allows the plotter to draw closer to the origin (at the expense of height)rotating the
elbow_centre_angleanti-clockwise makes the shape taller (at the expense of width)
Observations:
you will usually get the best results when the blue and red arcs are at the same height
the most useful drawing shapes are found when
elbow_centre_angle = 90˚
The outlines below show plots for elbow_centre_angle values of 60, 90 and 120 degrees. The
shoulder_centre_angle = -60˚ in each case.
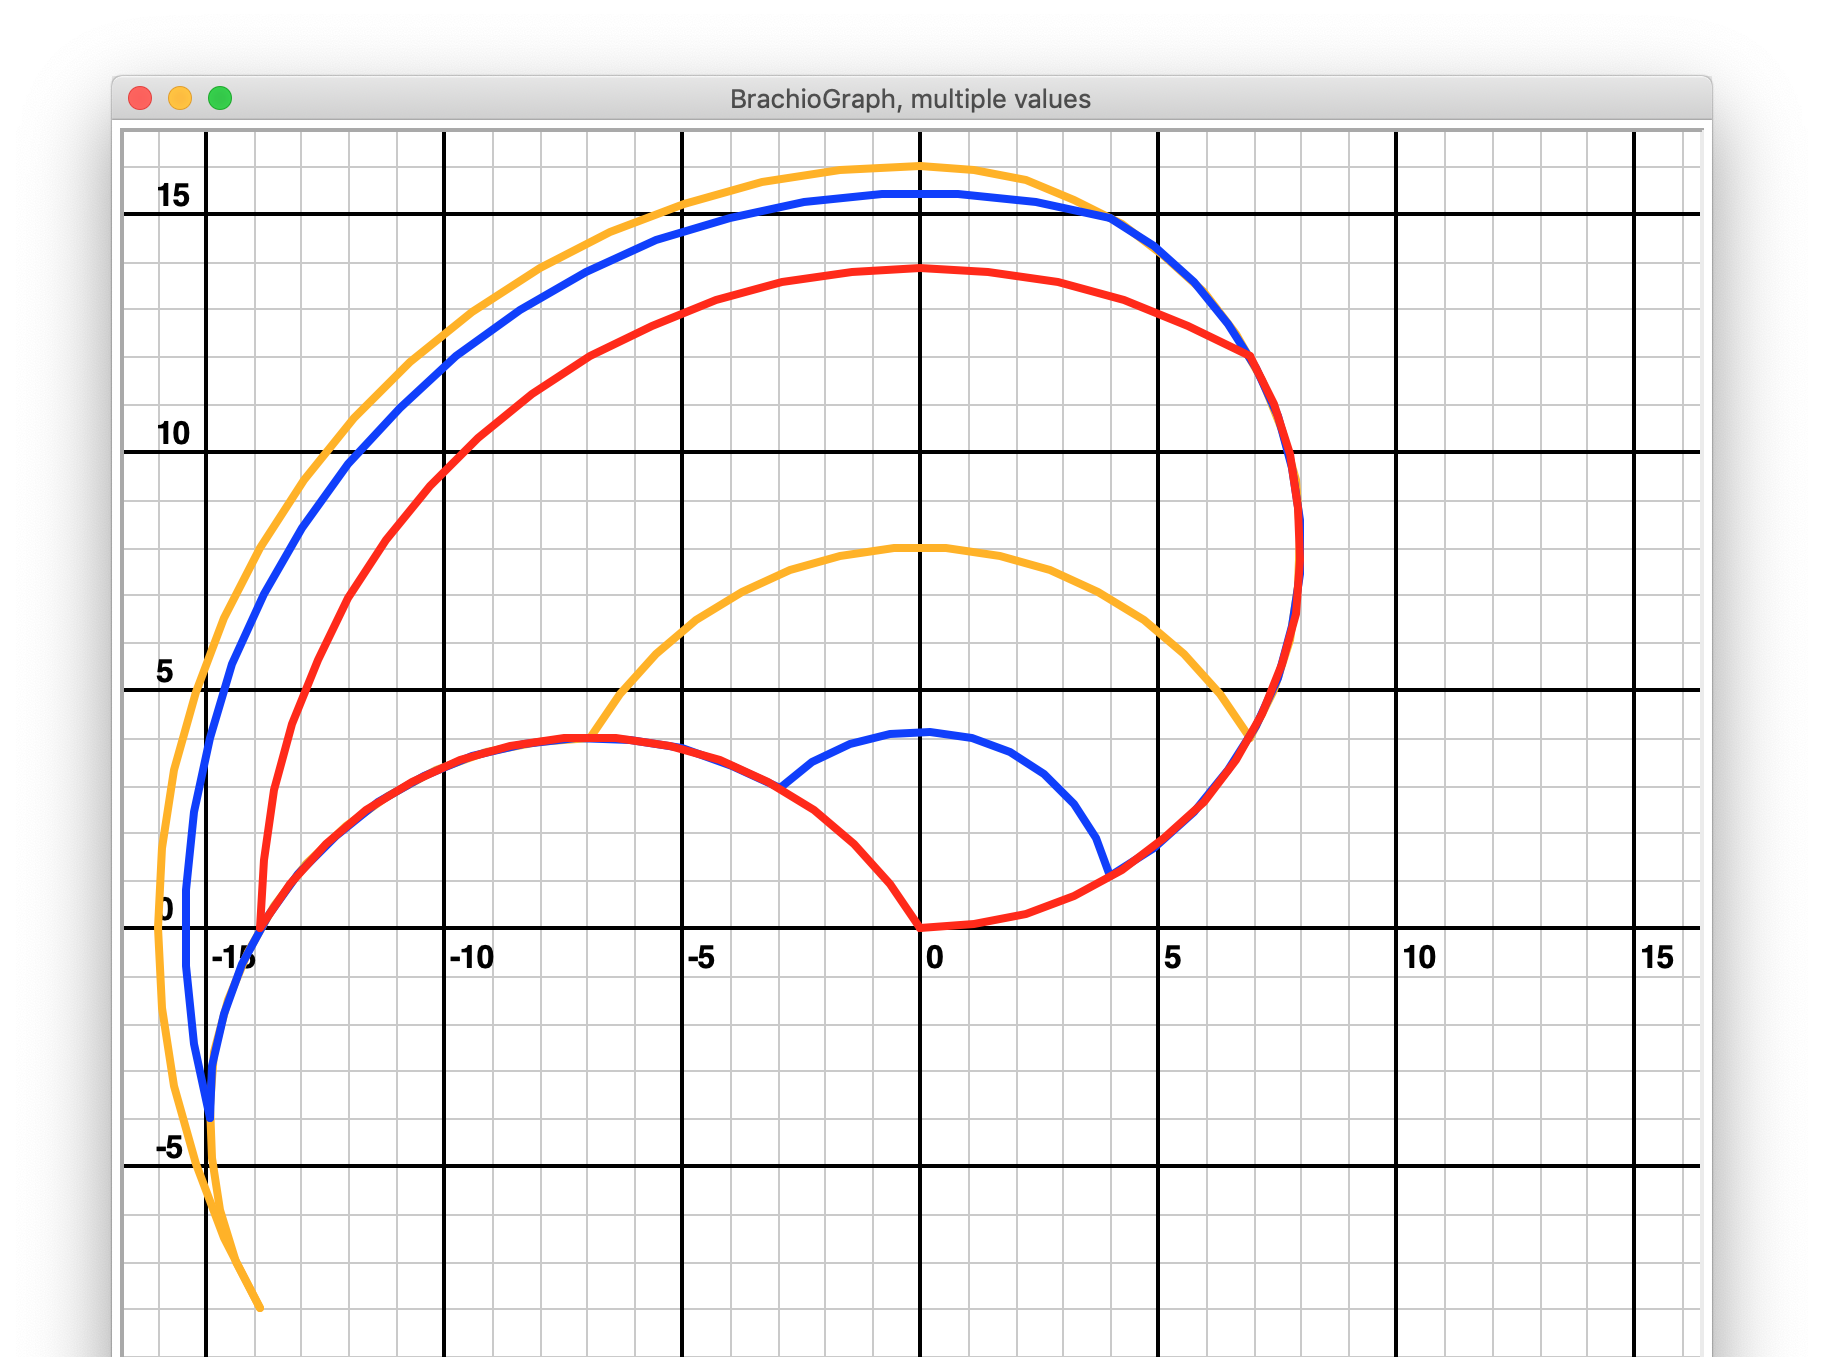
In the orange example (elbow_centre_angle = -60), the extra leftward movement of the outer arm gives extra us height
compared to the blue outline (elbow_centre_angle = 90), but we lose more than we gain around the origin.
The red example (elbow_centre_angle = 120) loses height at the top, and only gains useless drawing area very close
to the origin. Clearly, the blue outline is the most useful, even if we rotate the red and orange shapes to maximise
their utility. You can explore other values, but the 90˚ elbow_centre_angle appears to be optimal.
90˚ is not a magic number#
You will find that using 90˚ for the elbow_centre_angle is almost always best, but be aware that it is not always
the perfect figure. In the examples above, we were working on the basis that the drawing rectangle should be above
y=4. For different values of y, and for certain rectangle shapes, different values for the elbow_centre_angle
will produce different results.
However, for practically useful drawing shapes and realistic values of y, 90˚ appears to be the best result almost always, and even when it’s not, the difference between the results when using 90˚ and the optimum value are very small.
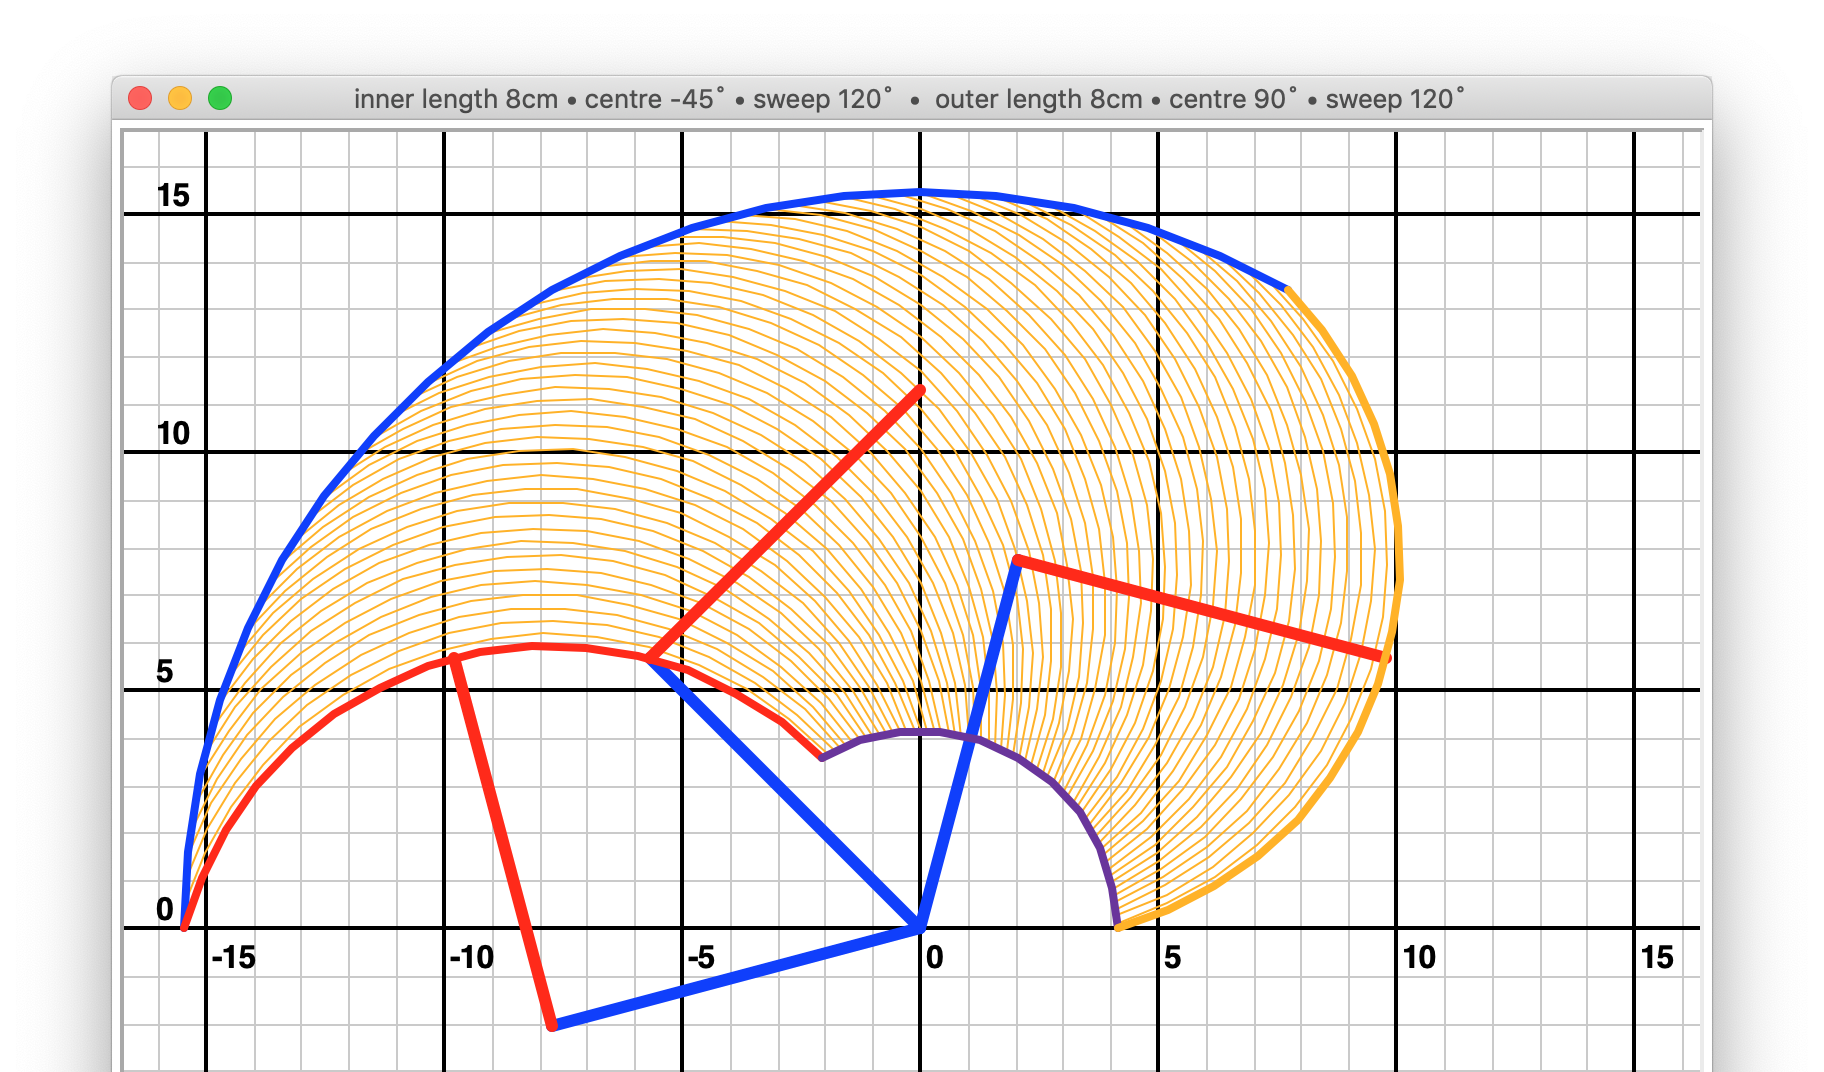
Working with arms of different length#
So far we have only considered BrachioGraph geometries in which the arms are of the same length. What if:
inner_arm = 9
outer_arm = 7
In this case, the maximum reach of the BrachioGraph is still 16cm, and the drawing area remains useful.
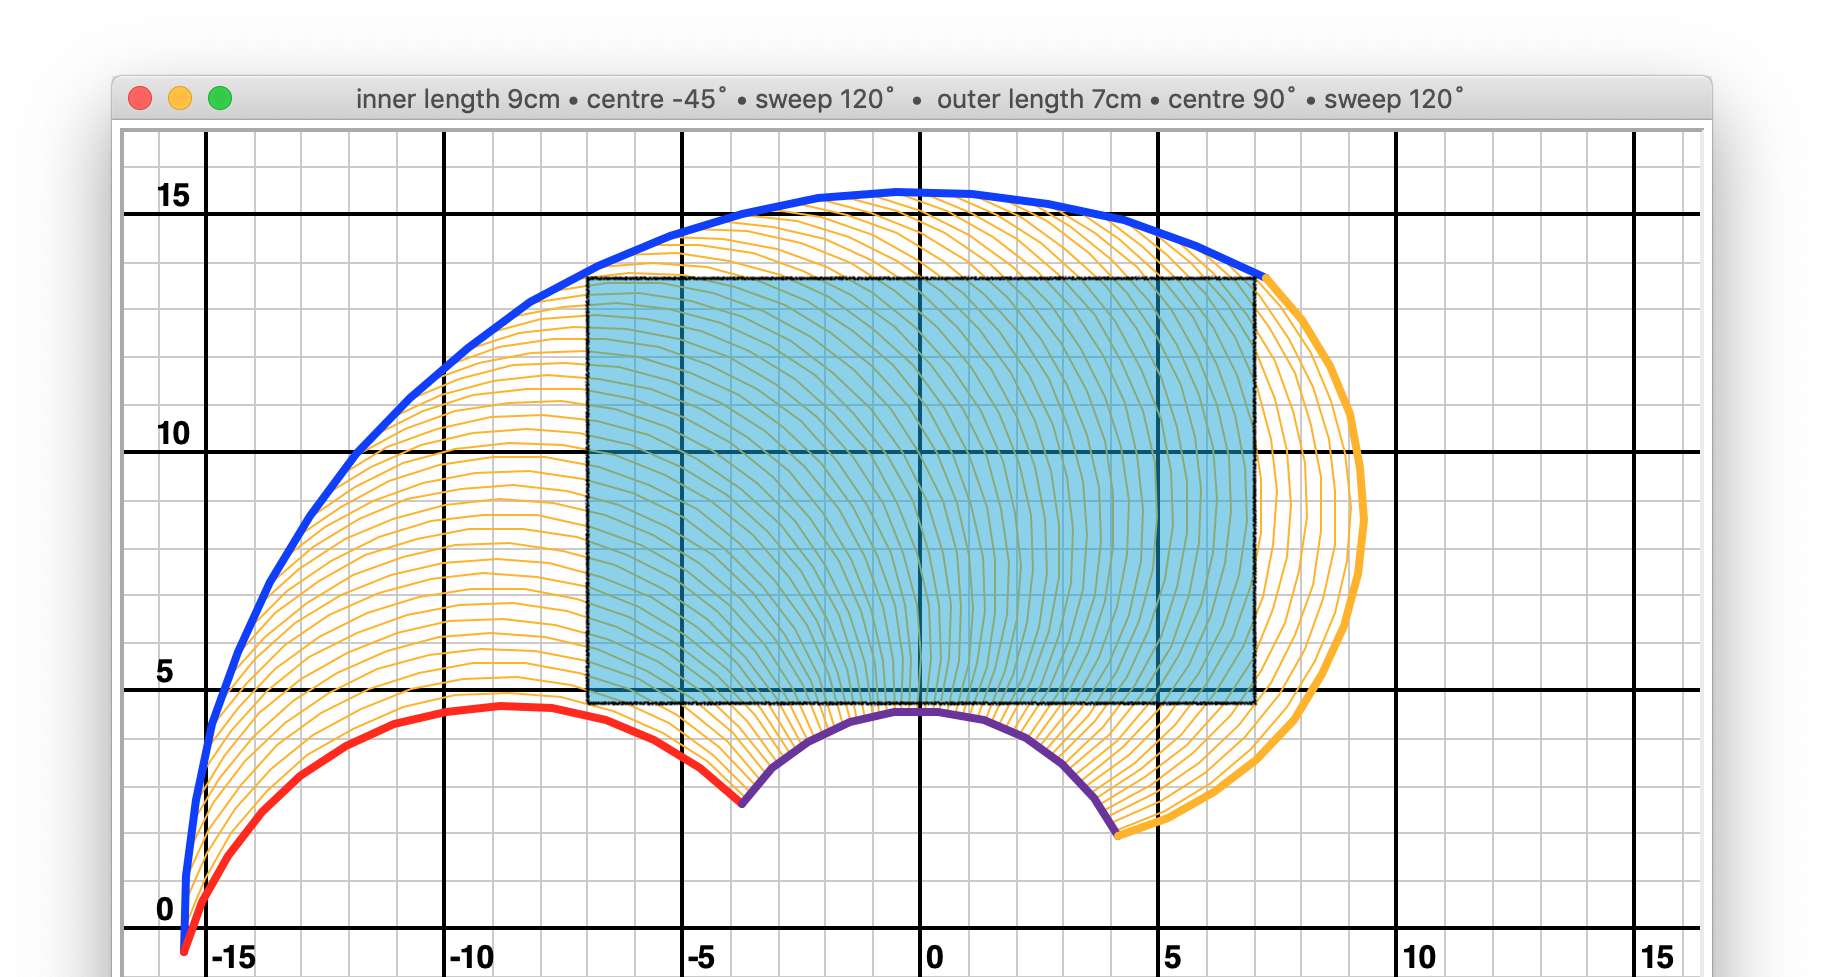
shoulder_centre_angle: -45
elbow_centre_angle:     90
shoulder_sweep:         120
elbow_sweep:            120

rectangles: 14 x  9 = 126
Having outer arms longer than the inner arms produces less useful results.
Donald Trump’s hair#
Of mild interest but no practical use whatsoever is the fact that the plotting area can be made to look remarkably like Donald Trump’s hair, even down to the colour.
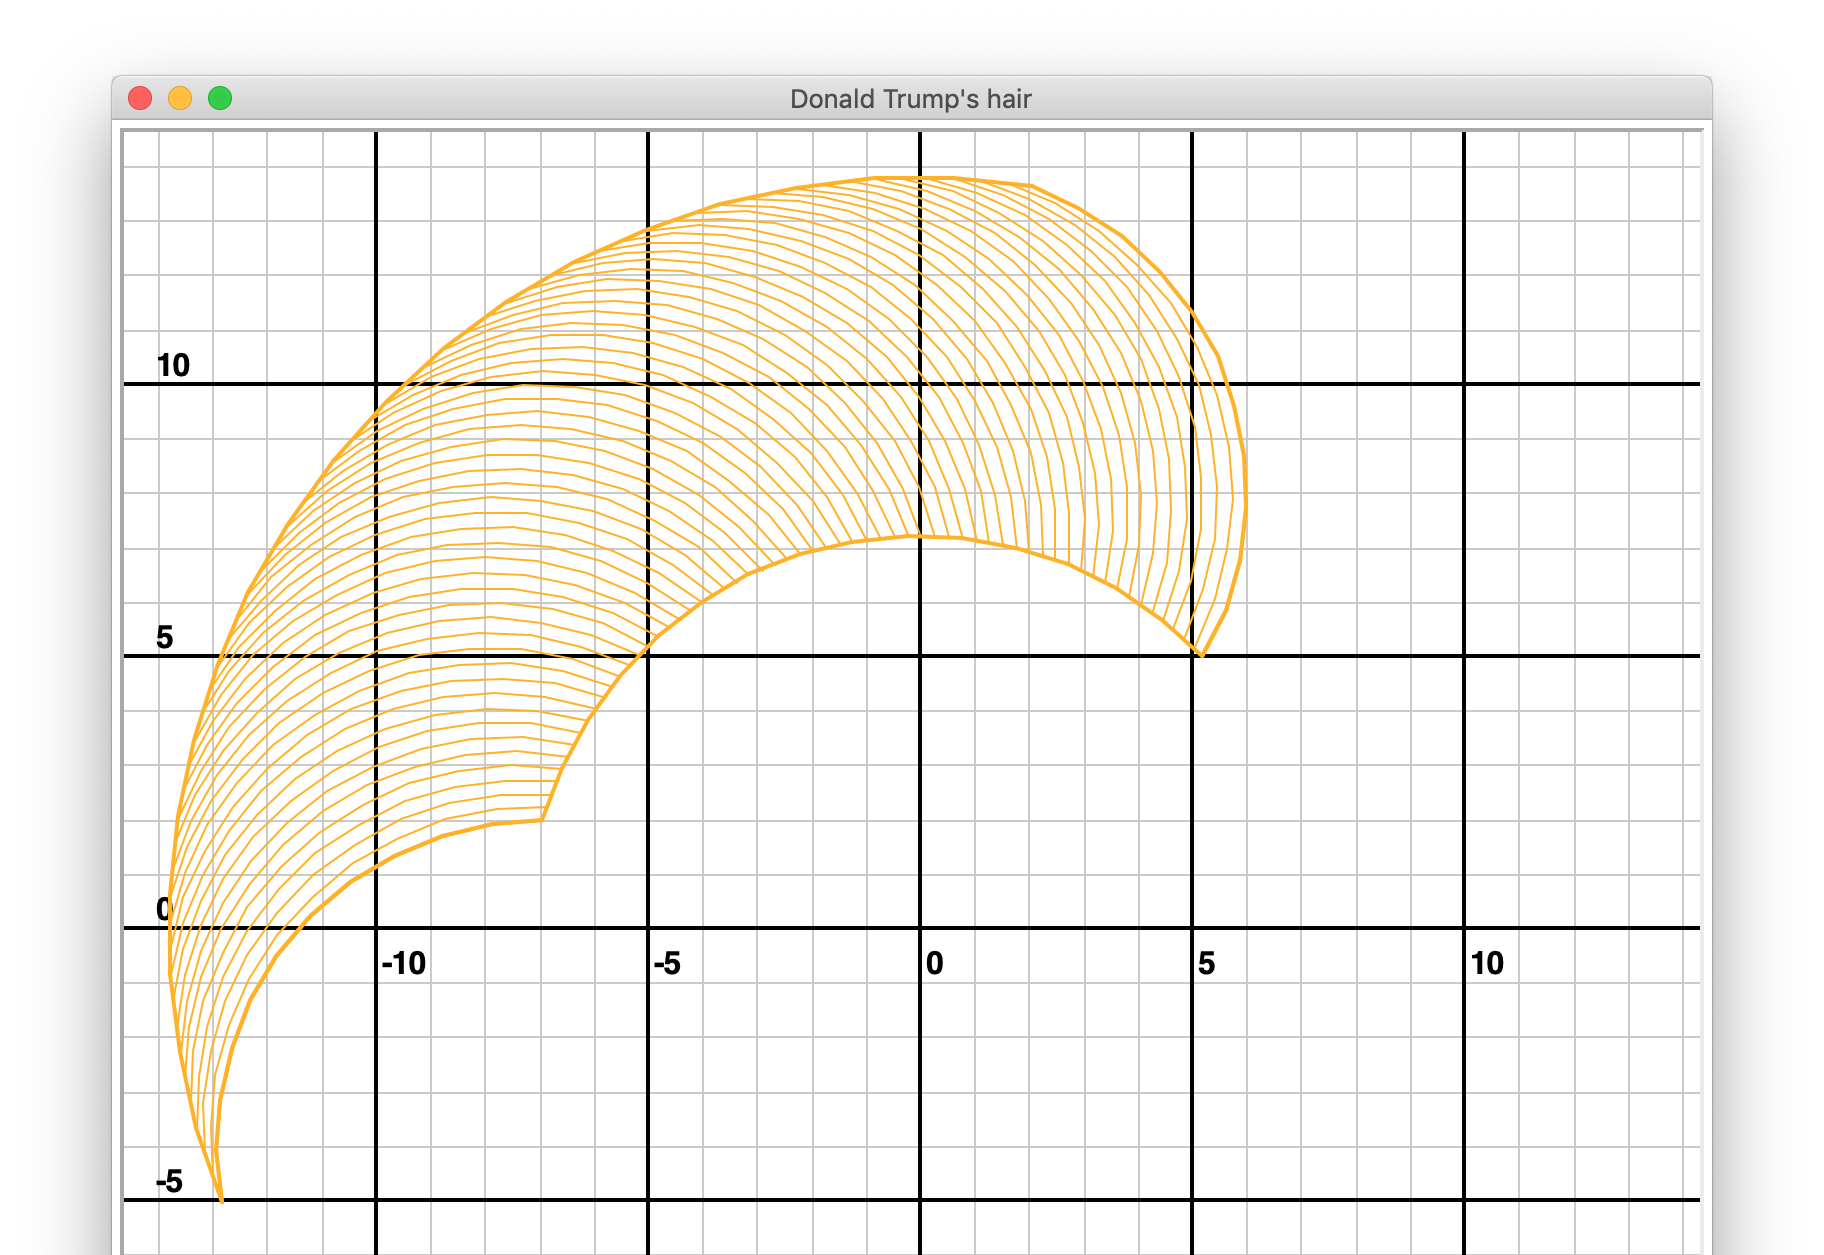
shoulder_centre_angle: -60
elbow_centre_angle:     70
shoulder_sweep:         120
elbow_sweep:            100