How to use the linedraw.py module to vectorise images#
The linedraw.py module converts bitmap images to vectors.
The main use you will have for linedraw is to take a bitmap image file as input, and save the vectorised version as:
an SVG file, to check it
a JSON file, to draw with the BrachioGraph.
Installation#
To use linedraw, you’ll first need to install opencv-python-headless (it’s not included in
the provided requirements.txt) with:
pip install opencv-python-headless
Using key functions#
Launch a Python shell, and import linedraw so you have the functions at your disposal:
from linedraw import *
Convert an image to JSON using image_to_json()#
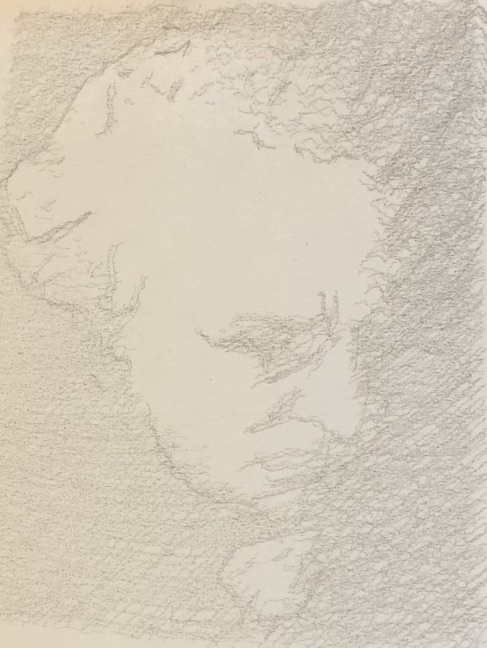
In the images directory, you’ll find an image named africa.jpg.
To convert it to a JSON file in the same directory, run:
image_to_json("africa", draw_contours=2, draw_hatch=16)
This will:
find a file in
imagescalledafrica(orafrica.jpg,africa.pngorafrica.tif)draw its contours, and hatch lines
create a JSON file called
africa.json(orafrica.jpg.jsonetc)create an SVG file called
africa.svg(orafrica.jpg.svgetc)
A value of 0 for draw_contours or draw_hatch will turn them off.
Smaller values mean more detail, higher values mean less. It’s worth experimenting with these values. Start with a
draw_contours of 2, and then values between 0.5 and 4. Start with a draw_hatch of 16, and then values between 8
and 16.
Emphasise the edges#
You can also provide a value for repeat_contours (or even repeat_hatch, though this is less useful).
For example, repeat_contours=3 means that the contour data will be added to the JSON file three times in
succession; the effect will be to draw them three times instead of just once, so the edges of the final image stand
out. This is especially effective with pencil drawings as in the example below.
Use the SVG file to check#
Check the results by opening the SVG file. You can draw the JSON file with BrachioGraph.plot_file("<file_name>").
Convert an image to lines using vectorise()#
If you’d like to get hold of the lines in code to process them in a shell or script, use vectorise(), e.g.
lines = vectorise("africa.jpg", draw_hatch=16, draw_contours=2)
(This is in fact what image_to_json() uses.)
This will generate two things:
a list of
lines, each of which is a list of pointsan SVG file as described above, to give you an idea of the vectorised representation
See vectorise() for full details of the parameters it takes.
Visualise how the plotter will draw the lines using draw()#
draw() takes a set of lines (as generated by vectorise()) and uses the Python turtle graphics module to draw
them, sequentially. It’s fairly slow - but faster than the actual plotter.